
In this post, we will take a look on six common key financial ratios including:
- Debt ratio
- Current ratio
- Return on sales ratio
- Asset turnover ratio
- Return on equity ratio
- Price-earnings ratio
Debt ratio
Debt ratio = total debt (liabilities) / total assets
Debt ratio (opens in a new tab) measures the extent of a company's leverage.
Leverage compares Borrowed money vs. Investment from owners/shareholders
Let's look at an example of balance sheet from the previous post about Financial Statements.
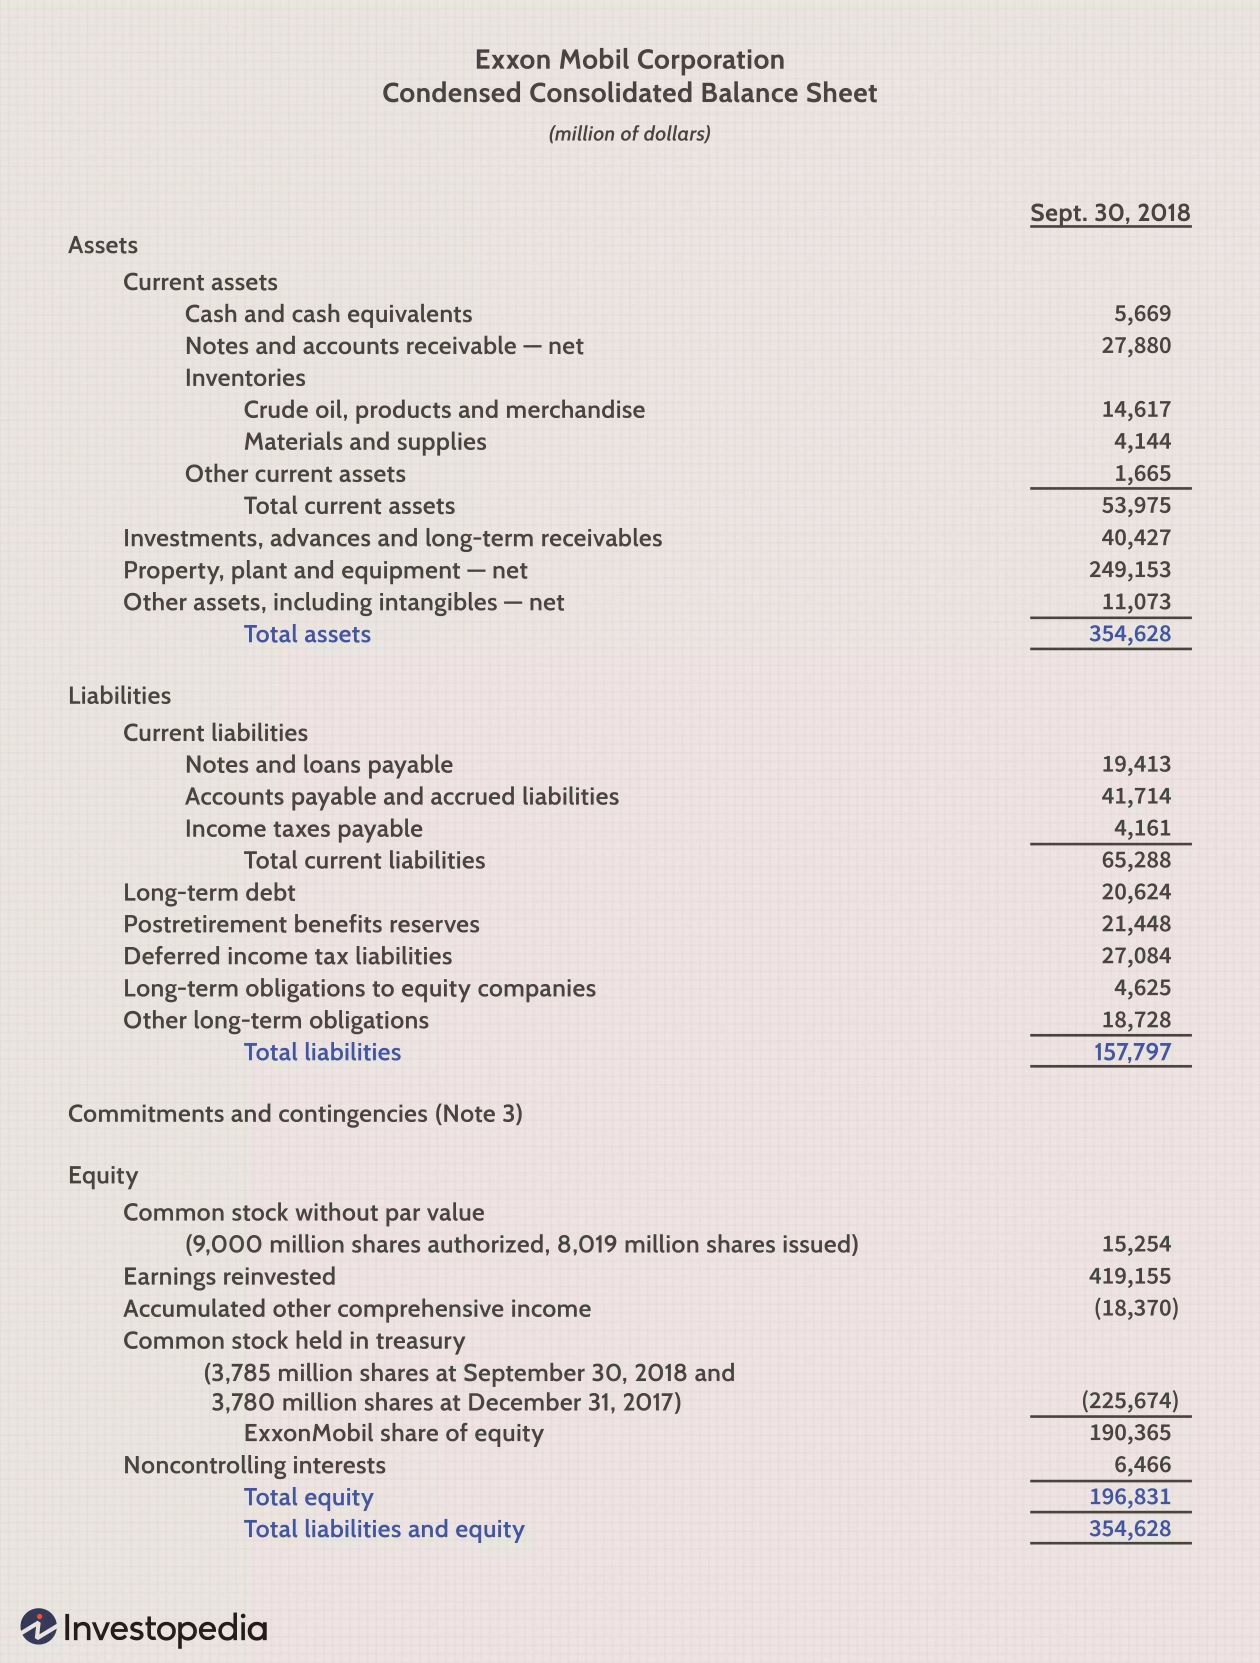
This balance sheet reports the company's total assets of ~$350B and the company's total liabilities of ~$160B. Using the formula above, the debt ratio is ~45%. The rest ~55% was invested by shareholders.
Debt ratio can be interpreted as the proportion of a company's assets that are financed by debt.
A high ratio indicates that a company may be putting itself at risk of default on its loans if interest rates were to rise suddenly.
Debt ratios vary widely across industries, with capital-intensive businesses such as utilities and pipelines having much higher debt ratios than other industries such as the technology or services sector.
NOTE: The average debt ratio for the large companies is 50-60%.
Current ratio
Current ratio (opens in a new tab) measures a company's ability to pay short-term obligations or those due within one year.
Current ratio = current assets / current liabilities
Current assets = cash, accounts receivable, inventory, and other current assets (OCA) that are expected to be liquidated or turned into cash in the next year.
Current liabilities = accounts payable, wages, taxes payable, short-term debts, and the current portion of long-term debt that are expected to be paid in the next year.
Accounts receivable and accounts payable are essentially opposites. Accounts payable is the money a company owes its vendors, while accounts receivable is the money that is owed to the company, typically by customers.
The current ratio of Exxon Mobil corp in the example above is ~$350B / ~$160B= ~2.2.
A current ratio of less than one may seem alarming, although different situations can affect the current ratio in a solid company. For example, a normal monthly cycle for the company's collections and payment processes may lead to a high current ratio as payments are received, but a low current ratio as those collections downgrade.
Return on sales ratio
Return on sales (ROS) is a ratio used to evaluate a company's profitablity. This measure provides insight into how much profit is being produced per dollar of sales.
ROS = net income / total revenue
Let's look an example of the income statement from the previous post.
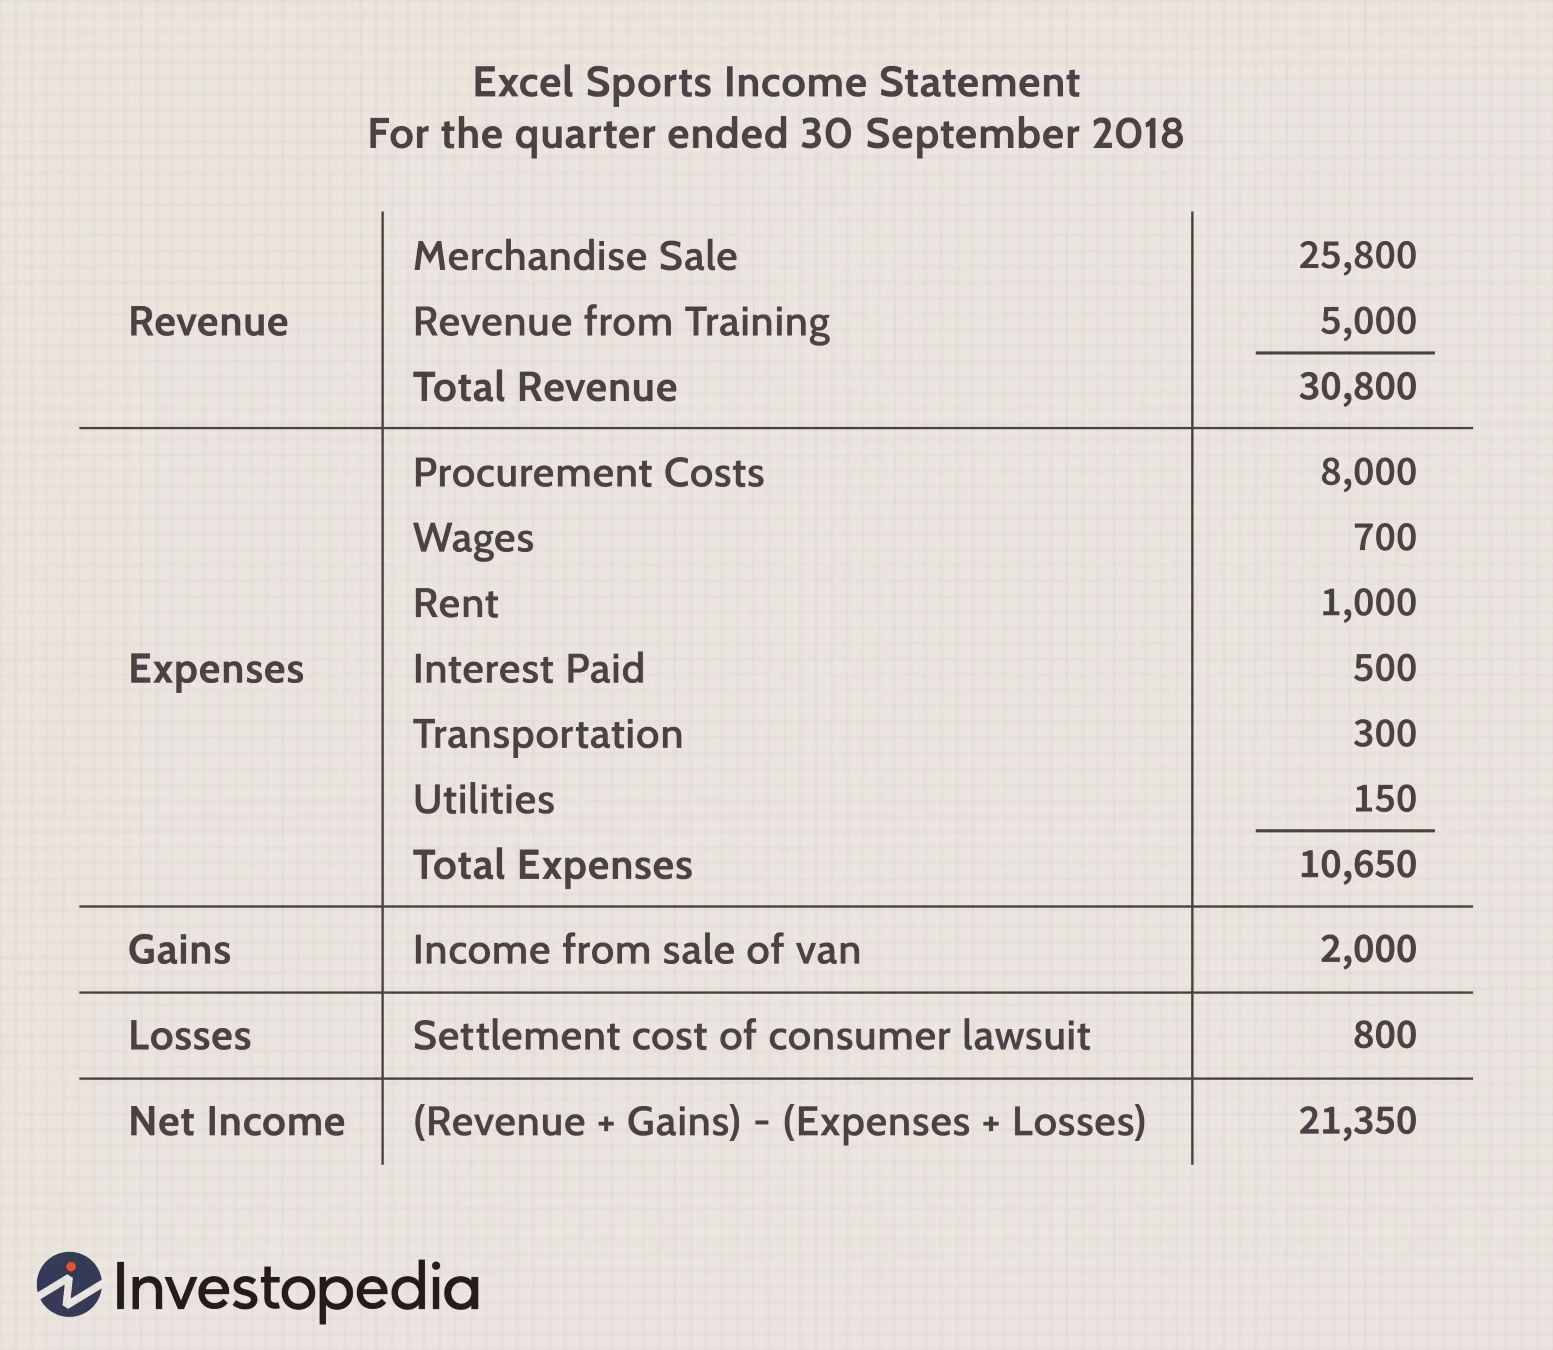
The company's ROS is ~$21k / ~$31k = ~67%. This means if the company has sales of 100$, the shareholders will keep 67$ after all the expenses have been paid. Again, this is super profit.
ROS is also known as the profit margin.
For high tech company like Facebook, ROS is usually over 20%. The businesses that sell commodities, groceries often have thin margin.
Asset turnover ratio
Asset turnover ratio measures the company's efficiency in using its assets to generate profit.
Asset turnover = total sales / ((assets at start of year + assets at end of year) * 0.5)
Let's look at an example below.
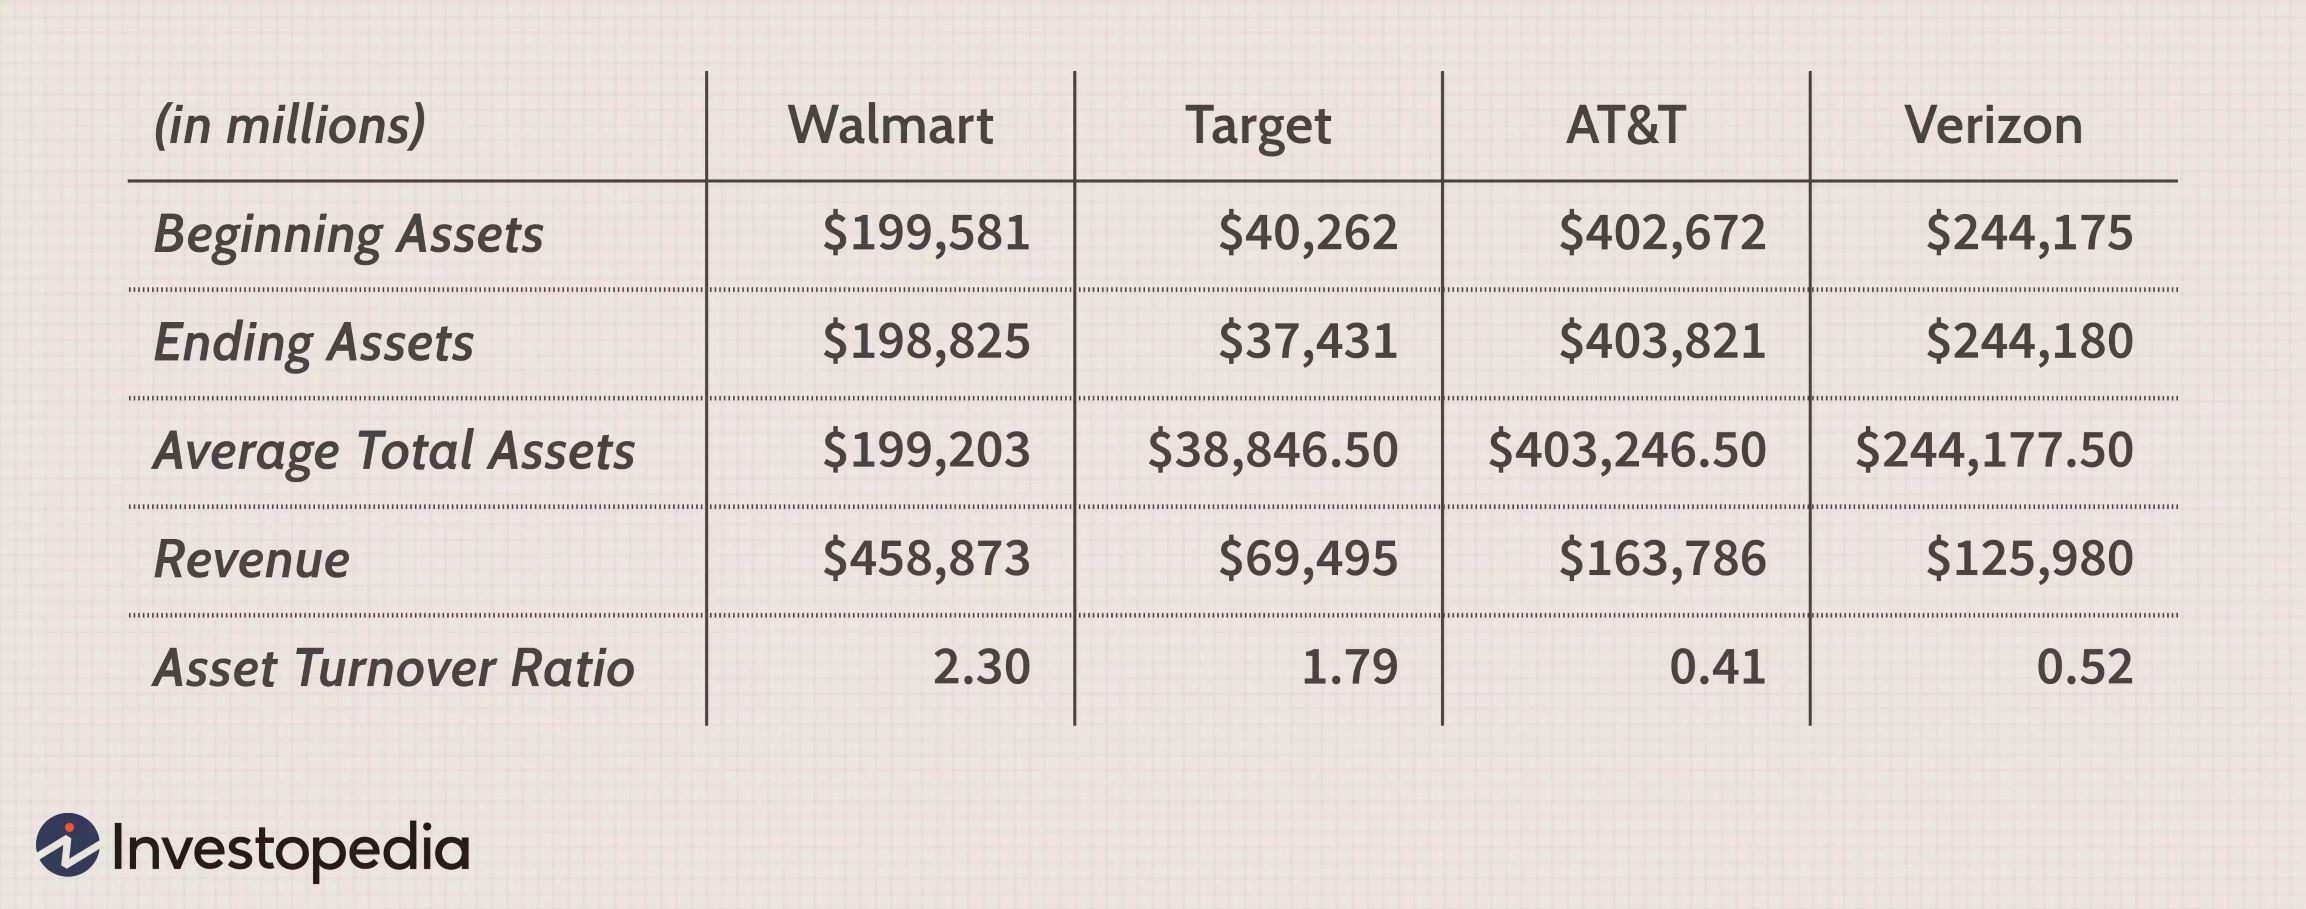
Given $1 in assets, AT&T can generate $0.41 in sales each year, while Verion can generate $0.52 in sales each year.
The higher the asset turnover ratio, the better the company is performing, since higher ratios imply that the company is generating more revenue per dollar of assets.
This ratio can vary widely from one industry to the next, comparing the asset turnover ratios of a retail company and a telecommunications company would not be very productive. Comparisons are only meaningful when they are made for different companies within the same sector.
Return on equity ratio
Return on equity (ROE) measures the profitability of shareholders' investment.
ROE = net income / average shareholders' equity
Shareholders' equity = total assets - total liabilities
We can find the net income in the income statement, and shareholders' equity or total equity in the balance sheet. In the above example of balance sheet, the total equity is ~$197B.
For example, in the fiscal year ending Sept. 29, 2018, Apple generated $59.5 billion in net income. At the end of the fiscal year, its shareholders' equity was $107.1 billion versus $134 billion at the beginning. Thus, Apple's return on equity is 49.4%, or $59.5 billion / [($107.1 billion + $134 billion) / 2]. This means Apple's shareholders earned 49.4% on their investment that year.
Usually, the ROE of most companies ranges 10-20%.
Price-earnings ratio
Price-earnings (P/E) ratio is used to determine a stock's relative valuation whether it is overvalued or undervalued. In another word, it measures the growth potential, earnings stability, and management capabilities. It also helps investors to answer the question whether the company's profitability will expand or shrink in the future.
Price-earnings ratio = market value of all shares / company's net income
Market value of all shares = market capitalization = market cap
Earnings = net income
For example, in 2020, Apple's market cap was $2.45T and its net income was $57.41B. Thus, its P/E was 42.67x. This number reflects the growth potential in the future of Apple.
Usually, P/E ratio of most companies ranges 10-30x.