
There're some known issues of data quality, such as.
- Common issues: consistency, accuracy, noisy data, missing data, bias, correlated data
- Labeling issues
This post will discuss and describe the solution to deal with them.
Common issues
Consistency: There are some examples of the inconsistency of data as below.
- Typo: Njce to m33t you, H e l l o, heLLo
- Different languages: thank you, merci
- Different scales/units: 10 cm, 10 ft, 10 km/h
- Mixed types: 10 cats, 10h
Accuracy: The sources that cause the data accuracy issue might be the method we use to collect the data or the features, the labels we assign to samples, the function we write to perform feature engineering, etc.
Noisy data: An example of noisy data is the outliers.
Bias data: Different sources cause the bias data. They might be sampling/selection biases, under/over-representation of some subgroups, human biases embedded in historical data, labeling biases, etc.
Correlated data: Highly correlated features can cause collinearity problems and numerical instability.
Missing data: Some features of some samples miss the value.
How to deal with common data issues
Sanitize data: The first thing we should do is use descriptive statistics to gain insights into our data to more effectively clean data later. Some overall statistics:
- Number of rows (instances/data points)
- Number of columns (features/attributes)
This information indicates whether you have too many features, leading to high dimensionality and overfitting problems.
Attribute statistics: Attribute statistics include the following properties of each attribute:
- Mean
- Standard deviation
- Variance
- Minimum value
- Maximum value
These properties help you get a better sense of the shape of attributes. This step allows you to detect the missing values and check data consistency and bias issues.
Multivariate statistics: Multivariate statistics deal with correlations and relationships between the attributes. A high correlation between two attributes can cause collinearity problems and numerical instability. This step helps you to detect the correlated data issue.
- Numerical variables' relationships: Using a scatter plot is an excellent visualization to spot unique relationships among numerical variables. For example, the image below shows strong linear relationships between
AreaandLot Size, betweenAreaandPrice.
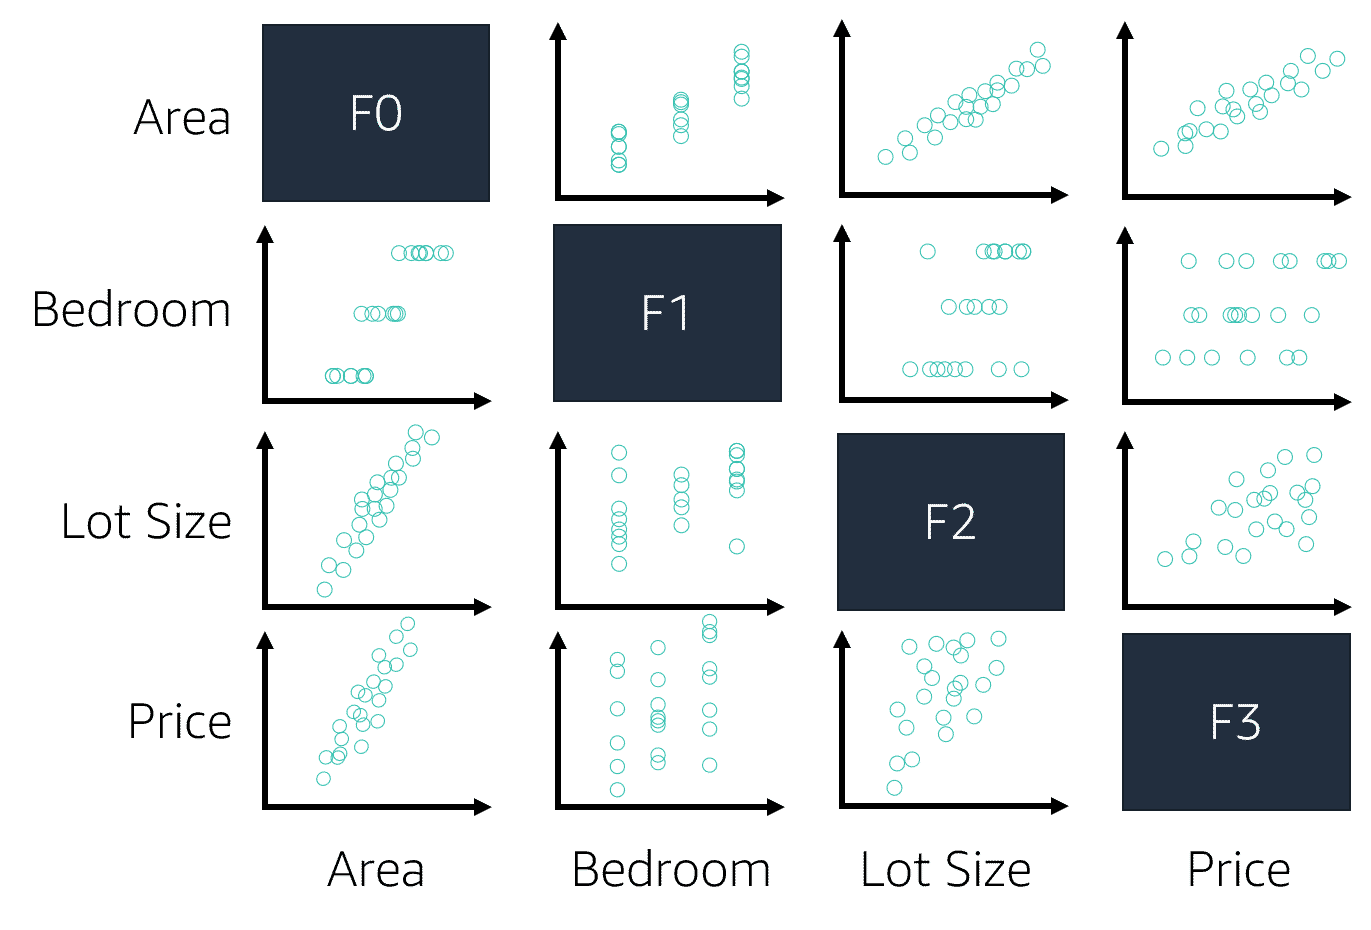
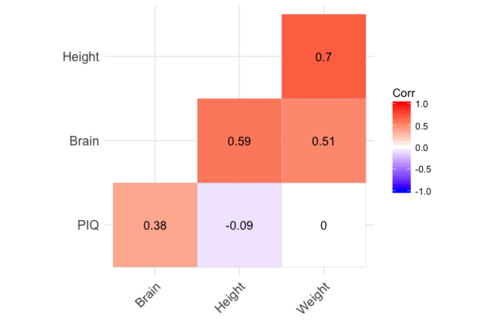
- Correlation matrices: Using scatter plot to visualize numerical variables' linear relationships. But to quantify these linear relationships, we use correlation matrix to convey both the strong and weak linear relationships among those variables. For example, if the correlation is zero, there's no linear relationship, but there still might be a non-linear relationship.
Clean data: After we have an overall understanding of the data, it's time to take a closer look and clean it. This step deals with the data consistency, noisy data, and missing data issues.
You might need to write some custom scripts for data inconsistency to fix this. You might not want to remove the outliers for noisy data because they might imply some hidden features. For missing data, solutions might be:
- Drop rows: may lose too much data -> cause overfitting
- Drop columns: may lose information in features -> cause underfitting
- Replace values by column mean, median, zero, most frequent value, other estimated value, or imputation method like MICEImputer from
sklearn,fancyimputepython package, etc. - Before performing the above methods, you should ask yourself:
- What were the mechanisms that caused the missing values?
- Are these missing values missing at random?
- Are there rows or columns missing that you are not aware of?
Visualization: Visualizing data helps you better understand features and relationships among them. Visualization should be done during the sanitizing and feature engineering processes. Visualization enables you to answer questions such as:
- What's the range of the data?
- What's the peak of the data?
- Are there any outliers?
- Are there any interesting patterns in the data?
- Should we sanitize/clean/preprocess this and that features?
Visualization techniques include visualizing averages and summary statistics using.
- Line charts
- Scatter plots
- Box plots
- Histograms
- Correlation matrix
- Heatmaps
- Confusion matrix
- etc.
Labeling issue

Despite the promise of unsupervised ML, most ML models today still need labels to learn. The performance of an ML model depends heavily on the quality and quantity of labels it's trained on. We will discuss the data labeling topic now.
Challenges of hand labels
- Expensive
- Violate strict privacy requirements if someone has to look at your data
- Slow as it's on a linear scale
- Aren't adaptive: when the task changes or data changes, we need to relabel
- etc.
Label multiplicity
Companies use data from multiple sources and rely on various annotators to obtain many labels. Using them indiscriminately without examining them can cause your model to fail mysteriously. Some problems are:
- Different label sources and different annotators lead to different levels of accuracy
- Different annotators lead to different levels of expertise which causes label ambiguity
- More data isn't always better. E.g., new data has is less accurate than original data
Some solutions:
- Need to have a clear problem definition
- Provide annotation training
- Data lineage: need to track where data/labels come from
Deal with the lack of labels
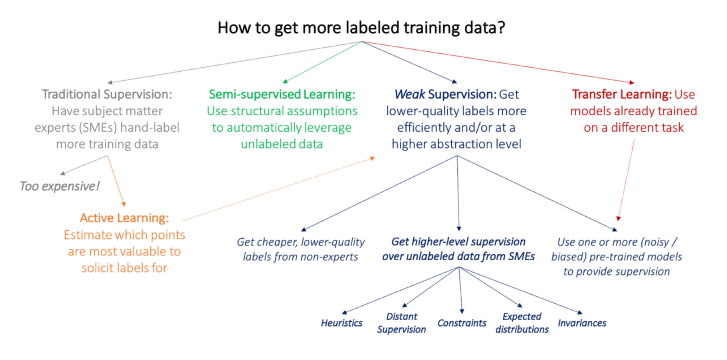
Semi-supervised learning: This method starts with a small set of labels and uses structural assumptions to generate more labels. For example, the hashtags #AI, #ML refer to Computer Science.
Weak supervision: We can use the labeling function, which is a function that encodes subject matter expertise with tools such as Snorkel.
def labeling_function(note):
    if "cancer" in note:
	    return "HIGH"
The table below compares hand labeling and programmatic methods.
| Hand labeling | Programmatic labeling | |
|---|---|---|
| Cost | Expensive: esp. when subject matter expertise required | Cost saving: Expertise can be versioned, shared, and reused across the organization |
| Privacy | Non-private: Need to ship data to human annotators | Private: Create LFs using a cleared data subsample, then apply LFs to other data without looking at individual samples. |
| Scalability | Slow: Time required scales linearly with # labels needed | Fast: Easily scale 1K -> 1M samples |
| Adaptability | Non-adaptive: Every change requires re-labeling the dataset | Adaptive: When changes happen, just reapply LFs! |
Transfer learning: This method applies the model trained for one task to another. It might or might not require fine-tuning (gradient updates). For example, fine-tune a model trained on language modeling to make it do sentiment analysis.
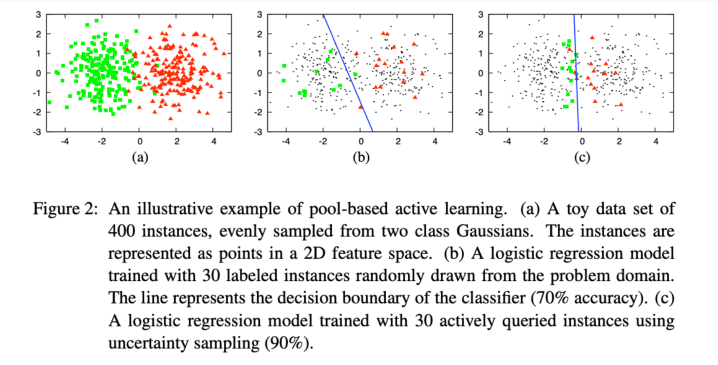
Active learning: Active learning still requires hand labels, but instead of randomly labeling a subset of data, you label the most helpful samples to your model. Check the image below for more details.
Ending
This post covered some common data issues and some solutions to solve them. In reality, you might need to consider whether you want to solve some problems, or you might even need to train some ML models with uncleaned data to create some baselines. This really depends on the project and your experience.